Pre-requisites:
- Setup
- Basics Overview
Objectives:
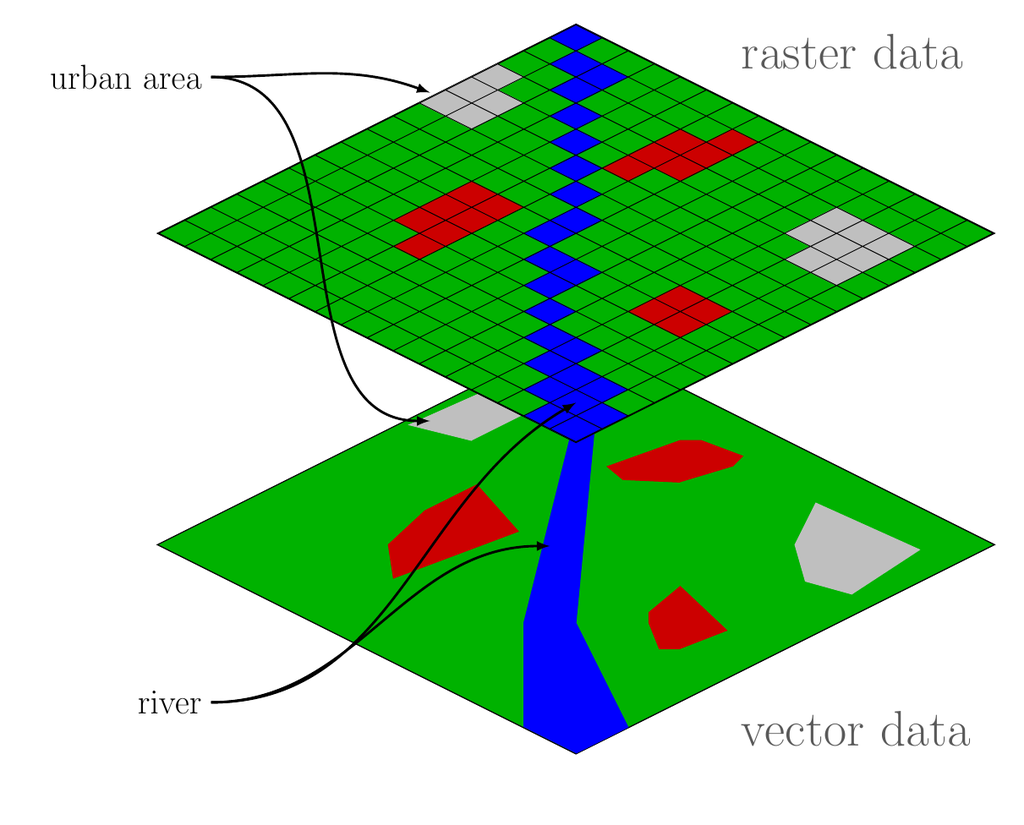
- Understand the difference between a raster and a vector dataset.
- Recognize a few spatial data formats.
- Import and understand vector data in QGIS
Exercise: Introduction to vector data in QGIS
Vector
 ref: 1
Vector data uses features (features are usually points, lines or polygons) to represent discrete phenomena in the real world. For example, a vector data file might include a river represented by a line which is assigned a value. For data which is associated with discrete entities like countries, landmarks, roads, etc. vector data is the way to go.

 ref: 2
Vector Data Types
The Geometry Object Model from the Simple Features for SQL specification:
This structure allowed developers to rely on a standard system for storing spatial data types and representing the relationships between different spatial data types.
Some of the most used spatial data types are:
- Point
- A Point is a 0-dimensional geometric object and represents a single location in coordinate space. A Point has an x-coordinate value, and a y-coordinate value. If called for by the associated Spatial Reference System, it may also have coordinate values for z and m.
- LineString
- A linestring is a Curve with linear interpolation between Points. Each consecutive pair of points defines a Line Segment. A line is a LineString with exactly 2 Points. A Linear Ring is a LineString is a LineString that is both closed and simple. A linestring is a series of connected points. These points act as vertices or nodes and are connected by curves. Each curve is assigned a start point and end point whcih represents the cardinality of the linestring. This cardinality is used to designate an order from the starting point to the end point.
- Polygon
- A Polygon is a planar Surface defined by 1 exterior boundary and 0 or more interior boundaries. Each interior boundary defines a hole in the Polygon. Polygons are topologically closed. The boundary of a Polygon consists of a set of LinearRings that make up its exterior and interior boundaries. No two Rings in the boundary cross and the Rings in the boundary of a Polygon may intersect but only as a tangent. A series of connected LineStrings.
Data formats
- Shapefile: Stores point, line, and polygon data. This file type is actually made up of a collection of files with the following endings: These are mandatory: .shp, .shx, .dbf There are many others which are optional, including the important .prj file that describes the projection information for that data.
- File/Personal Geodatabase: Esri proprietary spatial database. Very easy to load data into, not so easy to extract. Newer version of QGIS (2.8) is configured by default to read proprietary Esri geodatabases.
- GeoJSON: Encodes points, lines, and polygons (and collections of those) along with information about them using JSON (JavaScript Object Notation). This format is popular for web maps.
Exercise
This next exercise will explain the basics of importing, inspecting, and styling vector data using QGIS.
- Open QGIS and import vector data. Choose one of the following (iRods or Download zip):
- iRods access:
/iplant/home/shared/aegis/Spatial-bootcamp/basics/vector
- iRods is accessed through the iRods tool icon, or Menu Bar > Plugins > iRods. If the iRods plugin does not display then you either don't have it installed, or it has been disabled.
Once opened, enter your iPlant username and password: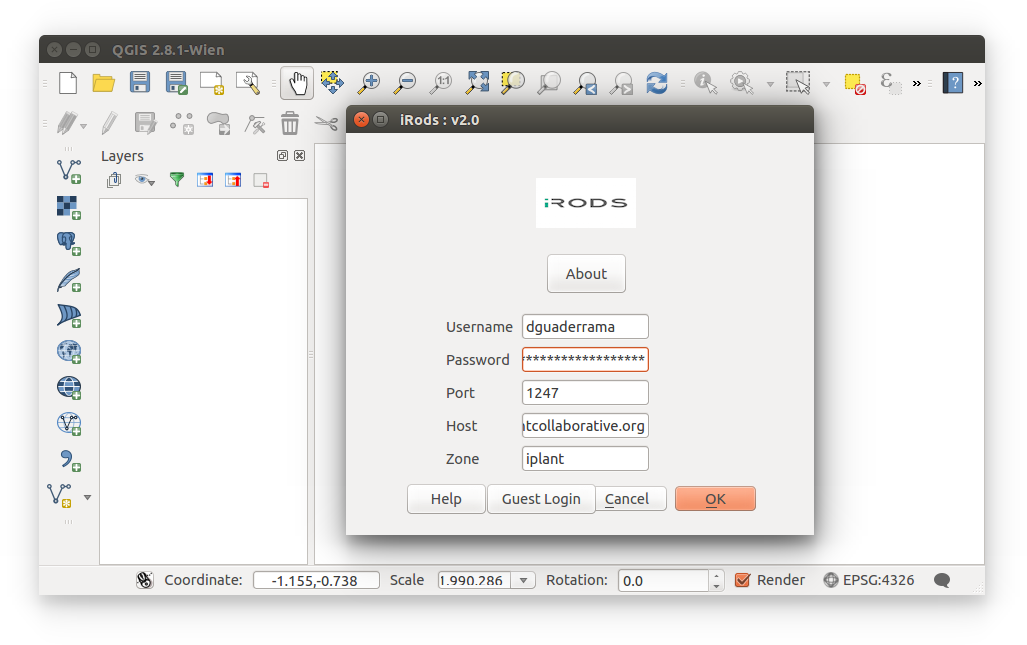
- Navigate to
/iplant/home/shared/aegis/Spatial-bootcamp/basics/vector - Within the
/vector/directory, click (to highlight) arizona_counties.shp, then import.
Notice the other files also named arizona_counties, but have different file extensions (not .shp). These are the files that hold information about the shapefile, but we do not import these into QGIS. QGIS will read them through the .shp. So, only import .shp.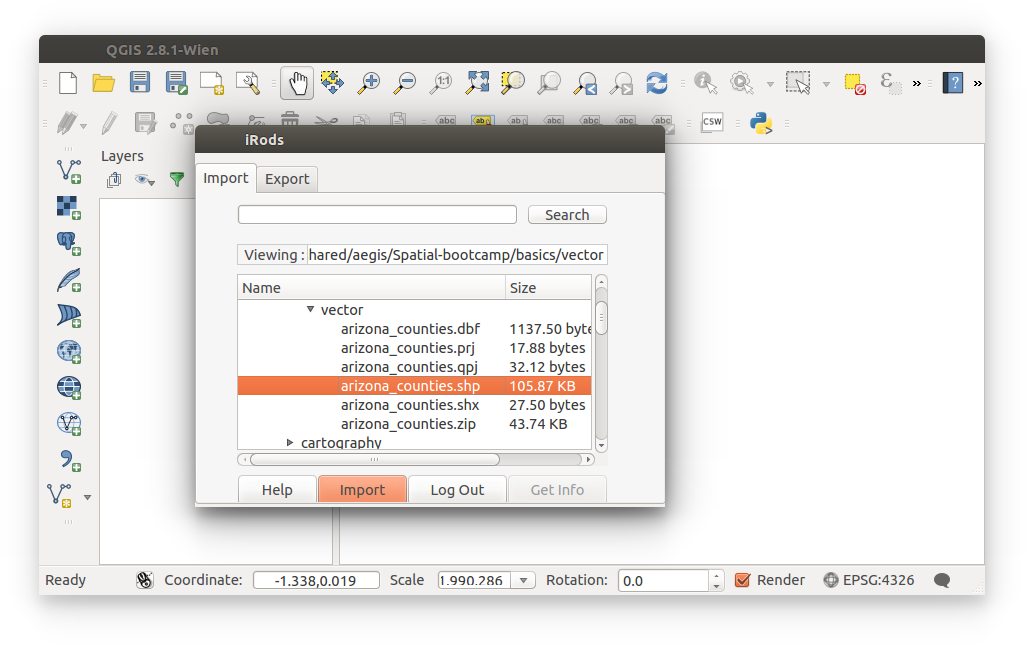
- iRods is accessed through the iRods tool icon, or Menu Bar > Plugins > iRods. If the iRods plugin does not display then you either don't have it installed, or it has been disabled.
- The non-iRods method: download, unzip, and import arizona_counties.shp:
Click to download:
arizona_counties.zip
- Import the Arizona Counties shapefile by clicking the Add Vector Layer
 button in the Toolbar, or by navigating through Menu Bar > Add Layer > Add Vector Layer.
Subsequent exercises will refer to adding data through the buttons in the Toolbar. - Click Browse to locate the shapefile: arizona_counties.shp
Reminder: A shapefile contains 5 files, however only open the *.shp extension in QGIS (or other GIS applications)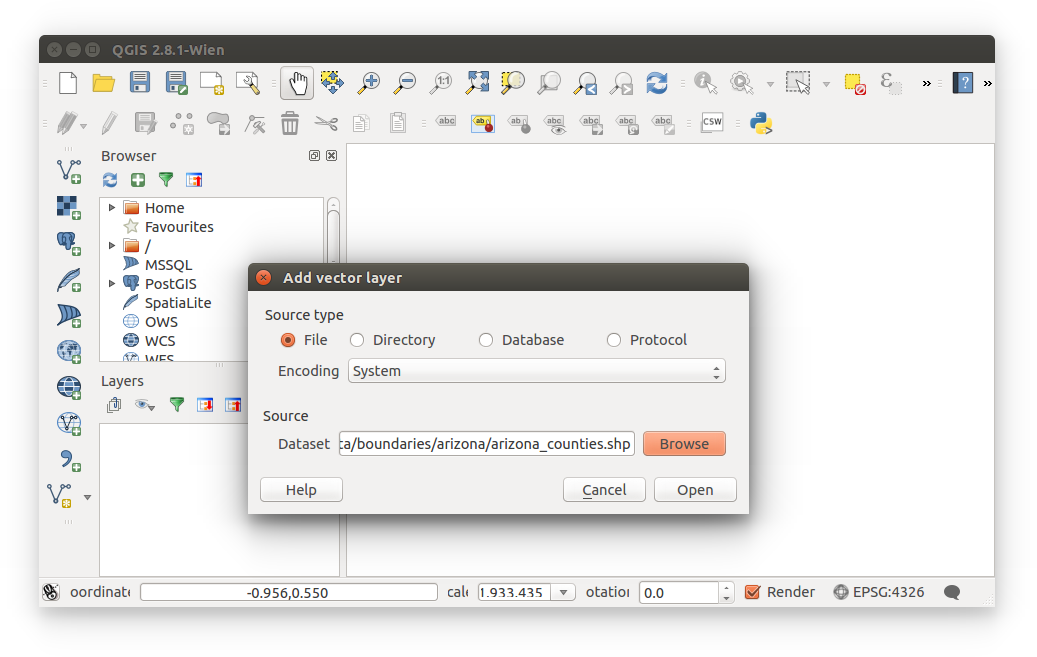
- We are now visualizing counties in Arizona.
Think about it: We are not actually visualizing the single boundary of Arizona, but the boundaries of its counties which complete the boundary of Arizona.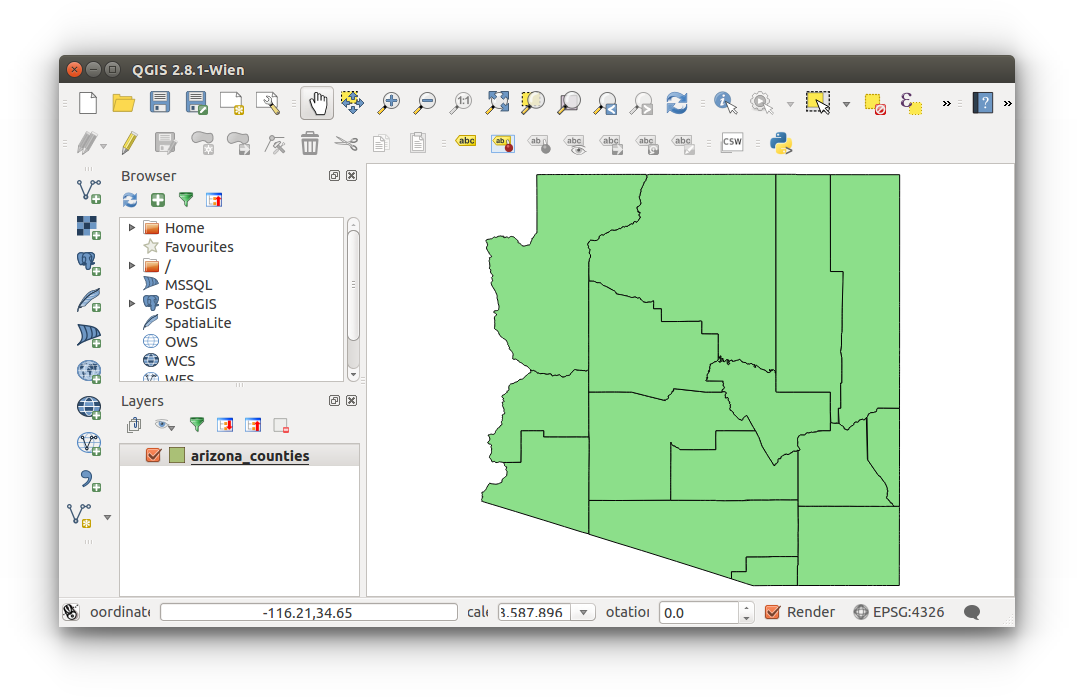
- Import the Arizona Counties shapefile by clicking the Add Vector Layer
- iRods access:
- View vector properties
- To view vector (and all layers) attributes, Right-click layer > Open Attribute Table
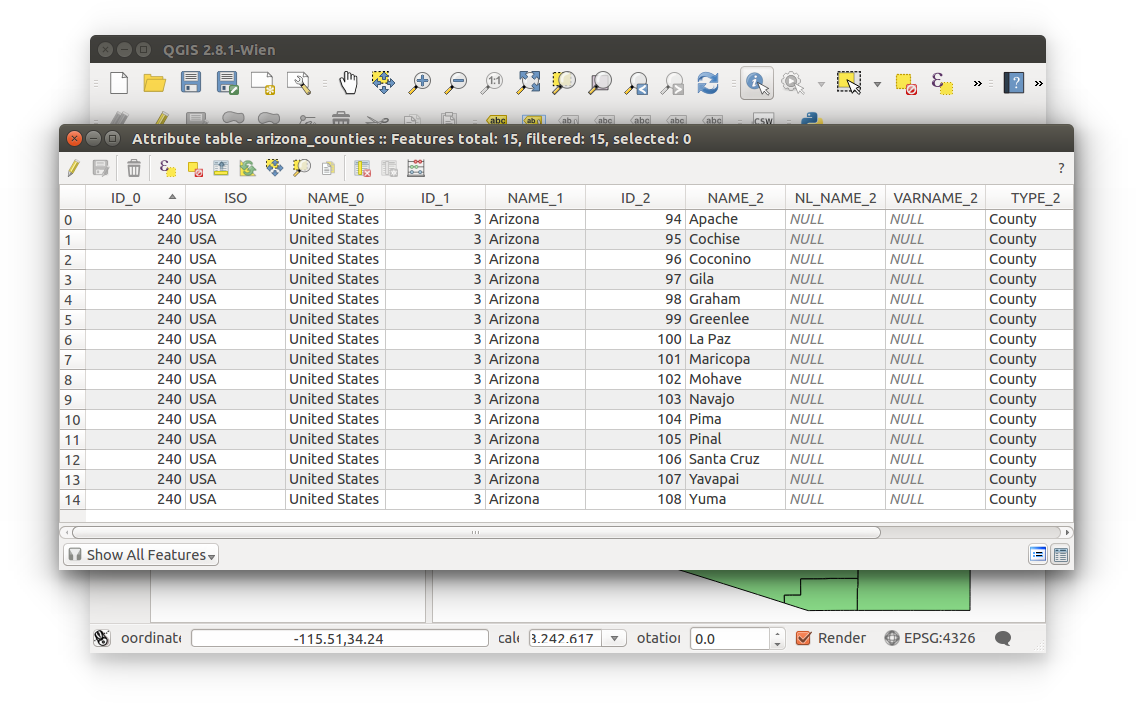
This data was extracted from Global Administrative Areas, which will be covered in Data Collection. This is simple boundary data; just gives us country, state, county name, and unique identifiers for each entry. Example uses of this type of data are: joining Census tabular data; visualizing boundaries; cutting satellite imagery to a desired area.
- To view vector (and all layers) attributes, Right-click layer > Open Attribute Table
- Styling
- You're able to customize how our data is visualized. Styles (like a template) can also be exported and saved for later use.
To style our arizona_counties layer: Right-click layer (layer list) > Properties > Style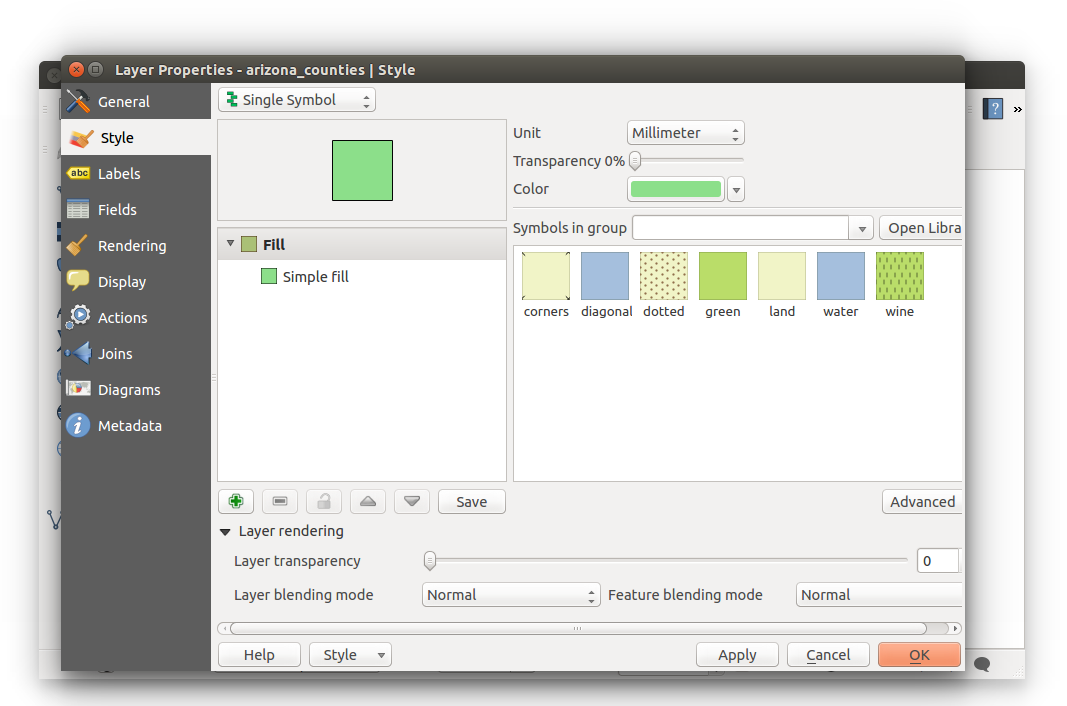
-
You can change the symbolism of the data by clicking on the dropdown list (default option is Single Symbol)
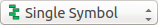 From the dropdown list, select Categorized
-
Once in the Categorized menu, configure as follows:
- Column: NAME_2
- Color ramp: Random colors
- Click Classify to add the data classifications from the column NAME_2.
If you remember from looking at our Arizona counties attributes, you'll know that NAME_2 represents the county name of each county.
Click Apply then OK to update changes.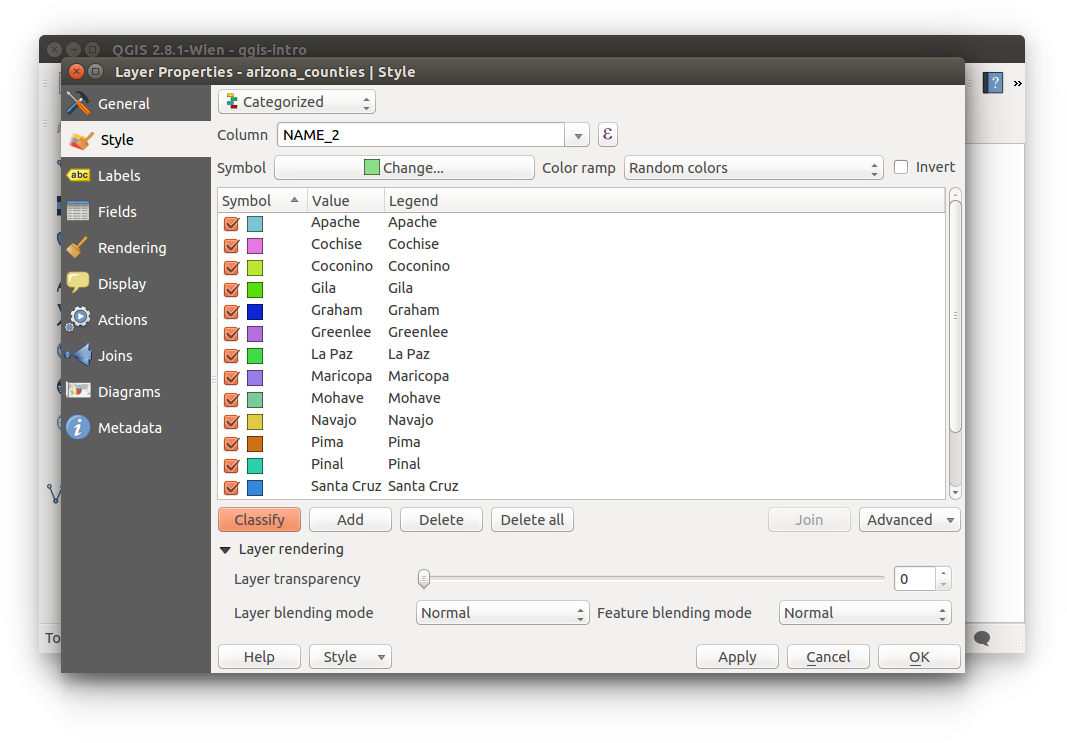
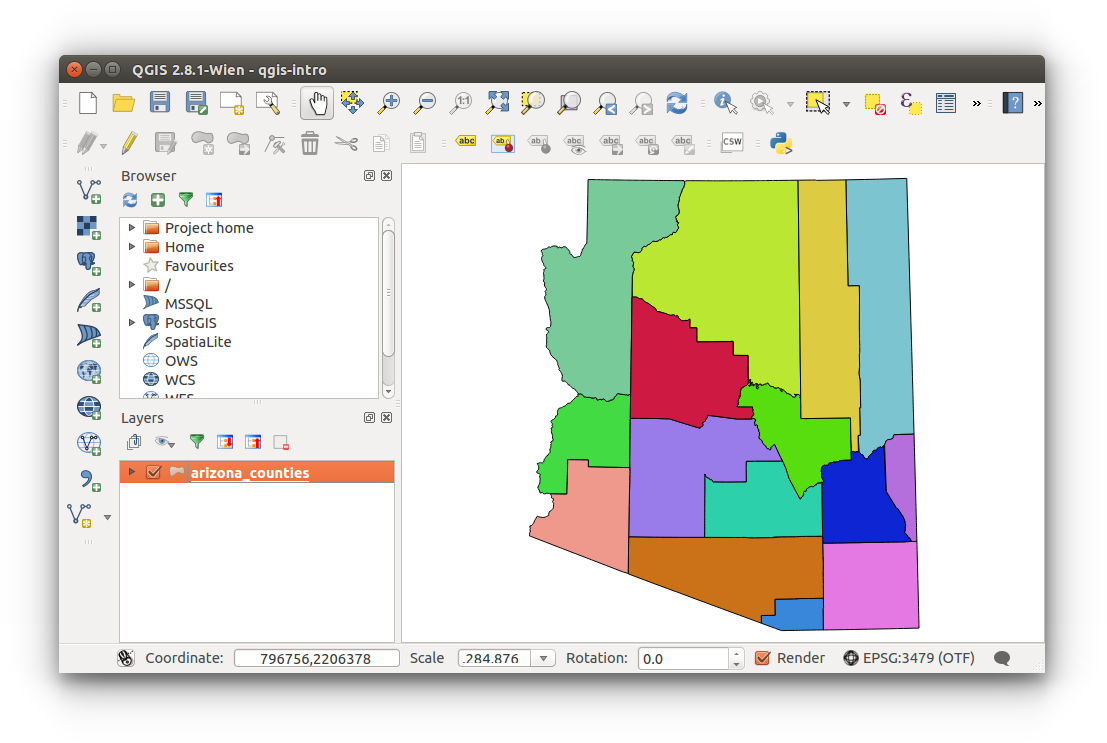
- Your map should now look similar to the one below; categorized by county name (NAME_2) with random colors.
You have now been introduced to shapefiles.
Refer to this exercise in the event that you have trouble importing shapefiles into QGIS.
Close your workspace- this will prompt to save your existing workspace; save if you must, else No.
![By Darth Stabro at en.wikipedia [CC-BY-SA-3.0 (http://creativecommons.org/licenses/by-sa/3.0/)], from Wikimedia Commons](http://commons.wikimedia.org/wiki/File%3AVectorBitmapExample.svg)