Pre-requisites:
- Setup
Objectives:
- Introduction to spatial data
- Introduction to QGIS
Exercise: QGIS Introduction
Is Spatial Special?
There have been numerous discussions about the nature of spatial data and whether or not there is anything special about spatial information. Since the Open Geospatial Consortium(OGC) created the Simple Features for SQL specification in 1999, spatial data can be stored alongside other data types as just another column in a table. However, if you look for it, you can see a lot of GIS professionals evangelizing the difference between spatial data and regular data. Is there really a valid reason that spatial data is more unique than temporal or text data types? Is it just GIS professionals trying to sell their expertise as a separate field?
Do they have a point?
There are definitely a few elements that set spatial data apart from other data types. One of the first differences is that spatial data comes in a variety of data types, which are each inter-related. Spatial data is also dependent on a few factors such as projection, ellipsoid, and unit of measure. Spatial data is naturally multi-dimensional but needs to normally be passed through a visualization application to understand. Finally, a sticking point for spatial data has been how should the data be organized effectively and how can the inherent relationships between objects be tested efficiently.
The specification helps to define a few words useful when dealing with spatial data.
A feature is an abstraction of real world phenomena.
The simple features for SQL defined a simple feature as a feature with all geometric attributes described piecewise by straight line or planar interpolation between sets of points.
Rasters and Vectors
There are two main families of spatial data which are each used for a specific function. Vector data, which represents discrete phenomena such as bus stations, and Raster data which represents continuous phenomena like temperature.
Exercise:
This exercise is simply a walkthrough of QGIS. It will cover the basics of the GUI and its layout, project properties, geolagorithms, and Providers.
QGIS brief overview
If you haven’t already, see Installing QGIS before continuing. Subsequent lessons depend on a QGIS installation.
1. About QGIS
![]()
QGIS is the best GIS tool in the free and open-source software (FOSS) community.
QGIS is a user friendly Open Source Geographic Information System (GIS) licensed under the GNU General Public License. QGIS is an official project of the Open Source Geospatial Foundation (OSGeo). It runs on Linux, Unix, Mac OSX, Windows and Android and supports numerous vector, raster, and database formats and functionalities.
This lesson is a brief exploration of QGIS. See the official QGIS User Guide here for topics not covered below.
2. Explore QGIS
- If you haven't done so already, open QGIS to begin exploring the interface.
Below is the QGIS graphical user interface (GUI), allowing for much easier access to geoalgorithms (as compared to the command-line interface!). It has the standard top menu bar and icons linking to most commonly used tools as you'd see in any other GUI. Data in the map view is of Washington state geology symbolized by geologic type.
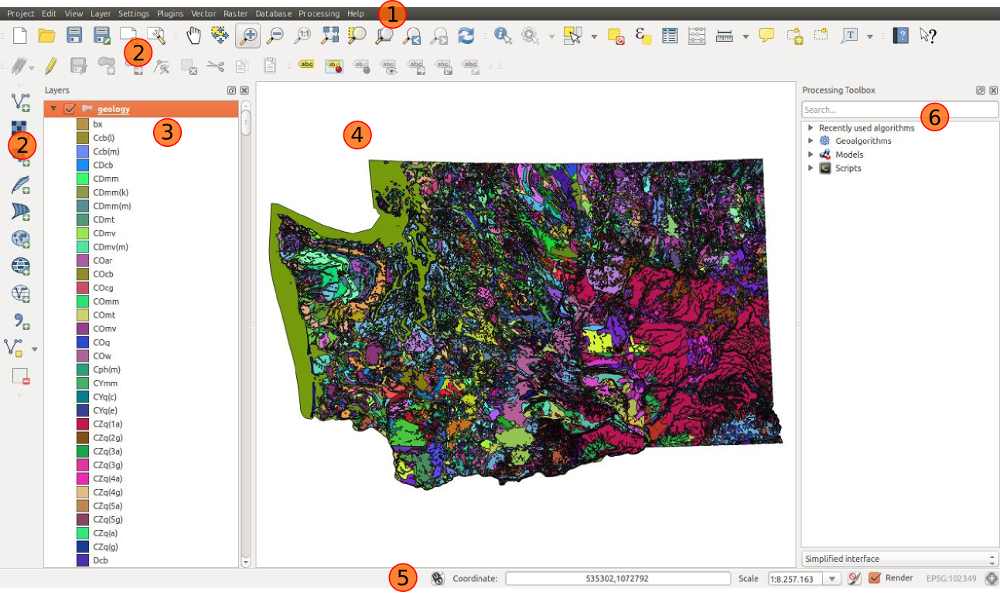
1. Menu Bar
The menu bar provides access to QGIS features. Hover over to view menu bar options. The QGIS version is displayed while not hovering over the menu bar. Most common features or tools are accessable through the toolbar icons which will be the prefered method throughout this QGIS introduction. Add data through Menu Bar > Layer > Add Layer
2. Toolbar
The toolbar provides access to most standard QGIS functions. Go to Menu Bar > View > Toolbars to activate or deactivate toolbars. Hover over tools to view the description and puropose.
3. Map Legend
The map legend is a list of all layers in the project. Each layer can be turned on or off with the layer's checkbox. It's possible to group layers.
4. Map View
The map view displays the active layers in the map project. You can set the map view extent by right-clicking on a layer and selecting Zoom to layer extent
5. Status Bar
The status bar displays current position in map coordiantes (e.g., meters or decimal degrees) as the mouse pointer moves across the map view. To the left of the coordinate display is the button gor toggling extents and mouse position display. To the right of the map coordinates is the scale, which may be set to one of the predefined zoom extends of 1:500 to 1:1,000,000. This scale setting will adjust as you zoom or pan throught the map view. Options for map rendering are to the right of the current map scale setting. To the far right is the current CRS for the map project.
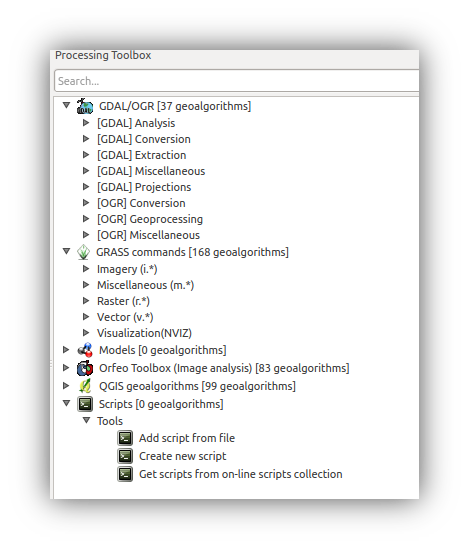
6. Processing Toolbox
The processing toolbox must be turned on by naviagting to Menu Bar > Processing > Toolbox. This helpful tool allows searching by keyword for the geoalgorithm from each of the active processing roviders.
- Project properties:
- To view project properties, navigate to Menu Bar > Project > Project properties
- Here in project properties you're able to give our project a title, configure projections, save to relative paths (because we're creating links to our data in order to import into QGIS!), and other items relate to the project itself. QGIS referes to projections as the Coordinate Reference System, or CRS.
- Vector/Raster geoalgorithms
- Vector and raster spatial functions are accessed through Menu Bar > Vector/Raster, or through the processing toolbox. QGIS refers to spatial functions as geoalgorithms, which are explained below.
- Working with Project Projections
QGIS allows users to define a global and project-wide CRS (coordinate reference system) for layers without a pre-defined CRS. It also allows the user to define custom coordinate reference systems and supports on-the-fly (OTF) projection of vector and raster layers. All of these features allow the user to display layers with different CRSs and have them overlay properly.[^2]
Each new project starts with the global default projection, [EPSG:4326 - WGS 84](http://www.spatialreference.org/epsg/wgs-84/):
proj=longlat +ellps=WGS84 +datum=WGS84 +no_defs
This can be changed at Menu Bar > Settings > Options > CRS > Default CRS for new projects
However, this is not the same as changing the project projection. You may define the project projection from Menu Bar > Project > Project Properties > CRS. Also keep in mind, the CRS of a new project will change to the CRS of the first layer added to the project.
'On the fly' CRS transformation is not enabled by the default QGIS installation.
3. Providers
QGIS utilizes spatial functions or geoalgorithms through a set of Providers which are also free open-source software. Below is list of some QGIS Provider.

4. Geoalgorithms
Some basic spatial functions are clip, buffer, and intersect. These are covered in Spatial Functions. So, QGIS is simply a graphical user interface for accessing these command-line-based tools. The main geoalgorithms are provided by GDAL, GRASS, and QGIS. Navigating through the Menu Bar will display the general name of the tools. Accessing these tools through the Processing Toolbox will display each Provider and their functions.
Geospatial Data Abstraction Library (GDAL) supports raster and vector formats, used for data translation and processing1.
Geographic Resource Analysis Support System (GRASS) is a software suite for geospatial data management and analysis, image processing, graphics and maps production, spatial modeling, and visualization2.
Both are Free and Open Source Software for Geospatial (FOSS4G)3.