Pre-requisites:
- Setup
- Basics Overview
- Vectors and Rasters
Objectives:
- Understand purpose of using a projection on a map
- Recognize a few projection types
- Reproject vector data in QGIS
Exercise: Understanding vector projections in QGIS
Coordinates
Data becomes spatial when it is assigned a location or coordinates. These coordinates allow us to reliably locate, transform and manipulate the data based on its location. In mathematics, coordinates are commonly represented using X and Y values on a chart.

ref: [^1]
Spatial data uses X and Y coordinates as well, however the spatial coordinates are related to a place on the earth. The X and Y values in this case often refer to Latitude and Longitude.
Latitude and Longitude

ref: [^2]

ref: [^3]
Projections
![By Djexplo (Own work) [CC0], via Wikimedia Commons - Earth Coordinate Reference System](http://spatialcarpentry.github.io/basics/assets/themes/twitter/images/earthCRS.png)
ref: [^4]
Projections characterize spatial data by setting coordinate reference systems for each data set.
Each projection is defined on top of a geographic coordinate system or spheroid based off of two ellipsoids, major and minor axes. These geographic coordinates systems deliver the coordinates in degrees and account for the fact that the earth is not a perfect sphere. will convert the 3d spheroid of the earth into a 2-dimensional representation. Each projection type utilitizes a different technique to project the earth's image onto a plane.
Distortion
Since projections attempt to represent the 3-dimensional globe on a 2-dimensional plane, they will all suffer from some level of distortion. It is important to choose a projection which preserves the elements you are interested in studying.
Coordinate Reference Systems
A Coordinate Reference System is built on top of a coordinate system. A coordinate system is a set of mathematical rules for specifying how coordinates are to be assigned to each point, also known as a projection. A coordinate reference system is a coordinate system that is related to the real world by a datum, this can also be known as a geographic coordinate system or spatial reference system.
ref: [^5]
Projections are another name for projected coordinate systems. These projected coordinate systems compose a family of Coordinate Reference Systems.
Projected coordinate systems are based off of Geodetic Coordinate Systems. These Geodetic coordinate systems are ellipsoidal models aimed at representing the aspherical nature of the earth.
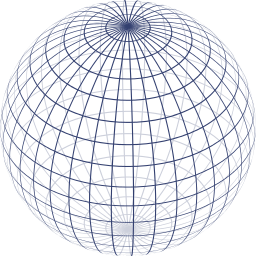
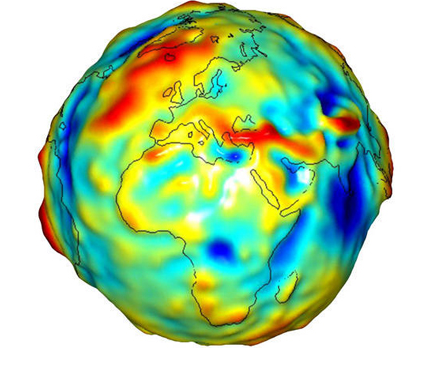
Earth as a Geoid
ref: [^6]
Although we normally see the earth represented as a sphere, its shape is actually more irregular. The earth has an equatorial bulge and various other undulations due to tectonics, volcanics and the earth’s rotation.
The changes in the surface mass are the subject matter of Geodesy. Geodesists use differences in the vertical direction of gravity along with crustal, tidal, and polar motion to determine exact measurements of the Geoid. Geometric computations can become unwieldy processes due to the complicated nature of the Geoid surface. In order approximate the geoid while making geometric calculation feasible, reference ellipsoids were calculated.
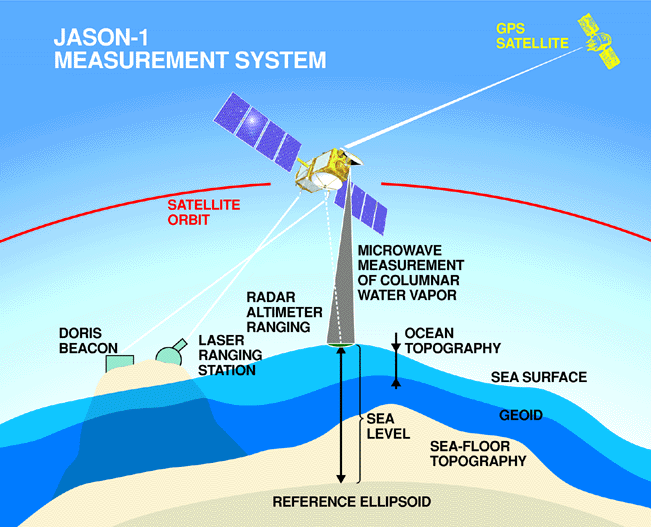
Reference Ellipsoid
ref: [^7]
Reference ellipsoids have evolved over the years, moving from regional approximations to more precise global systems.
Regional ellipsoids like the North American Datum of 1927 which minimized distortion for the contiguous United States at the expense of more distant regions.
The modern reference ellipsoid, WGS 84 was developed using satellite measurements and past Geodetic System parameters, and has been the reference ellipsoid used by the Global Positioning System.
Most modern projections will use WGS 84 as the underlying reference ellipsoid, but it is important to check that your projection is defined correctly if you are dealing with old datasets.
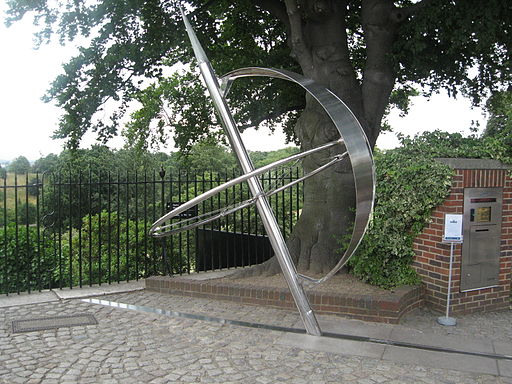
Central Meridian
Greenwich is the standard central meridian used in global projections. This point is given the value of 0° Longitude and serves as the origin the Global Positioning System. This delineation also leaves decides the use of Greenwich Mean Time as the standard time.
ref: [^8]
The Greenwich meridian has a monument dedicated to it in several cities.
Projection Properties
Conformal
ref: [^9]
Also known as fidelity of shape, these projections preserve shape. This means that scale distortion must be the same in all directions and each parallel must cross every meridian at right angles. These projections are important for navigational and large-scale mapping[^17] Examples include Mercator, and Lambert Conformal Conic.
Equal Area
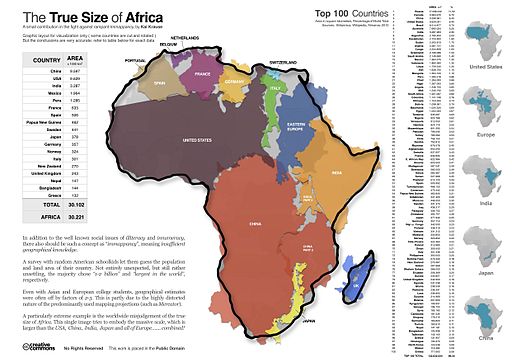
ref: [^10]
Preserves the area relationships between regions. This maintain the proper ratio of area between regions. An example of this is the Mollweide projection. These projections are useful for statistical comparisons.
Equidistant
Preserves the proportional distances between any two points from their spherical distances.
Geometric Projection Types
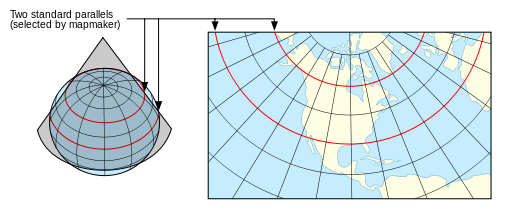
Conic
ref: [^11]
Conic projections are created by projecting part of a sphere onto a cone. Conic projections tend to be useful for representing data in temperate climates due to their location. Conic projections are not useful for representing global phenomena due to their construction.
Azimuthal
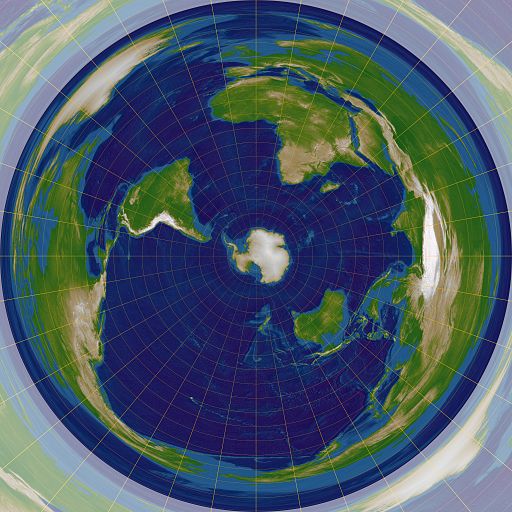
ref: [^12]
Azimuthal projections are created by flattening a side of the sphere from a reference point. Azimuthal projections are useful for mapping polar data.
Cylindrical
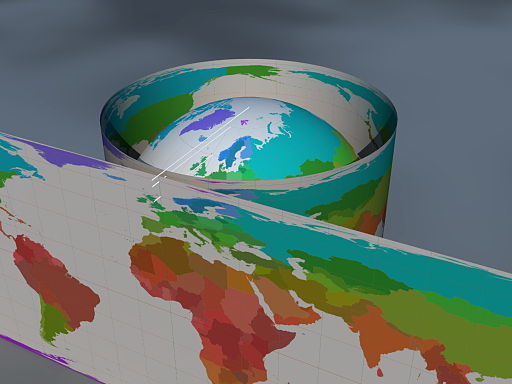
ref: [^13]
Cylindrical projections are created by projection a sphere onto a cylinder. Cylindrical projections suffer the least distortion along the line that it intersects the sphere, which is often around the Equator. This makes cylindrical projections useful for mapping tropical data. Examples include Mercator and Universal Transverse Mercator.
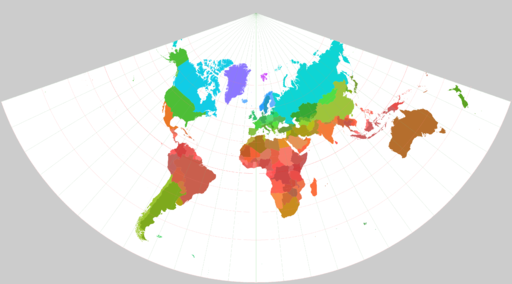
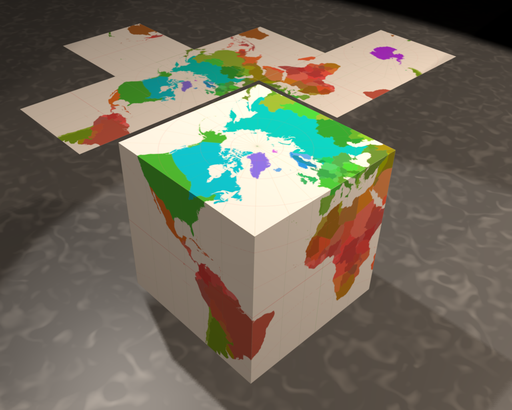
Polyhedral
ref: [^14]

ref: [^15]
Polyhedral projections, also known as interrupted projections seek to minimize global distortion by tearing the sphere at specific areas. A common method for creating polyhedral projections is to coerce the sphere into a 3-dimensional geometric object such as a cube which is the then unraveled. Some examples include Dymaxion and Waterman’s butterfly.
SpatialReference.org is an extremely useful resource that houses definitions for all official projections in a variety of formats. This is a great place to find proj4 strings.
PROJ.4 is a cartographic projection library written in C (programming language), used for converting projections.
Since there are a few thousand different projections, with their own area of interest, it is likely that you will come upon datasets with different projection in your project. The easiest way to resolve projection disputes is to decide on the projection for your project before gathering data and save the proj4 string assigned to the projection. This string will allow you to project your datasets to the proper coordinate reference system.
EPSG:4326 (WGS84) |
Custom proj4 |
NOTE: When reprojecting a raster, you should also resample your raster to ensure that the cells have the same width and height. The cells will distort in the new projection and most GIS software will refuse to read a raster with irregular cells.
Projection Exercise
There are several methods to reproject data. Two methods are explained below; a temporary change of projection within a QGIS project, or reprojecting the vector and saving it to the file.
This brings up an excellent point; always check your projection! Always!
Projection errors are very common and are often misunderstood. It make take some time before fully nderstanding. Practice makes perfect.
This next exercise will explain projections and reprojections in QGIS. Very important!
1. Changing project projection
- Open a new project and import vector california_boundary.shp through iRods:
/iplant/home/shared/aegis/Spatial-bootcamp/basics/raster/california_boundary.shp
Or download here, unzip, and Add Vector Layer :
:
california_boundary.zip
Your workspace should look similar to the one below: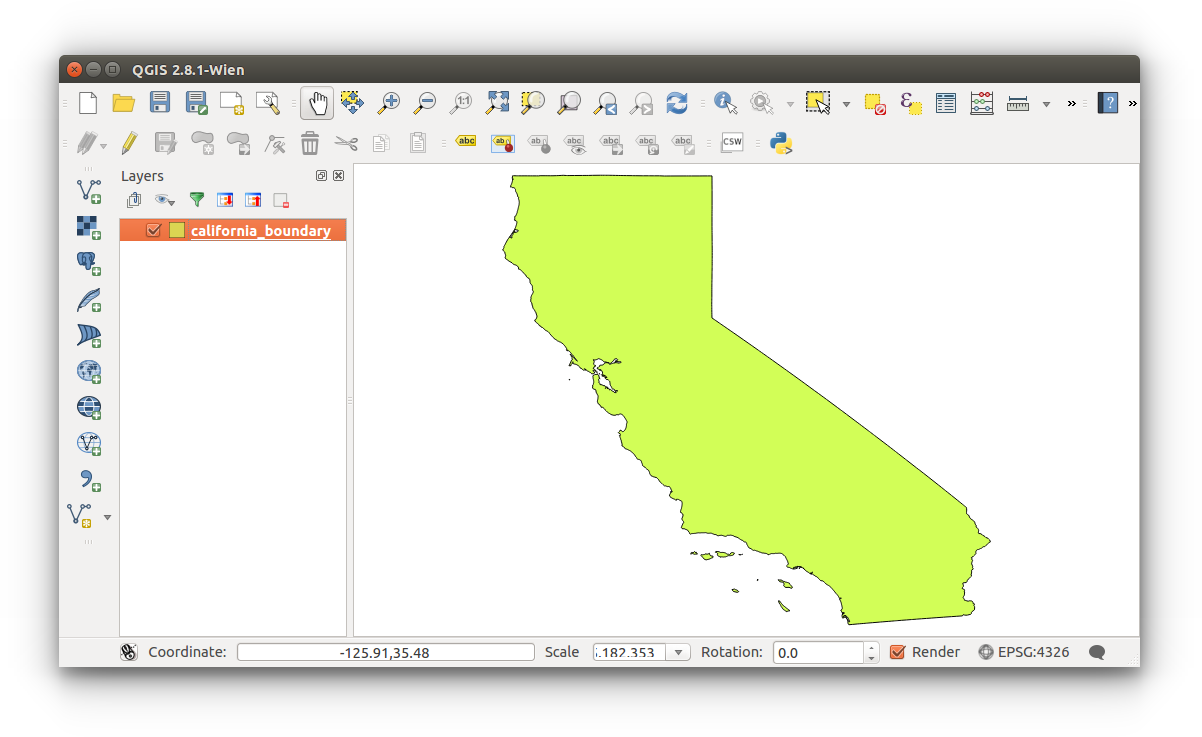
- Configure projection
- There are several methods to configuring projections: set layer projections, set project projection (with on-the-fly projection), and reprojecting layers. There are also several methods to reprojecting layers which is covered later in this section.
- To view the current map projection, look towards the bottom right of the QGIS GUI:
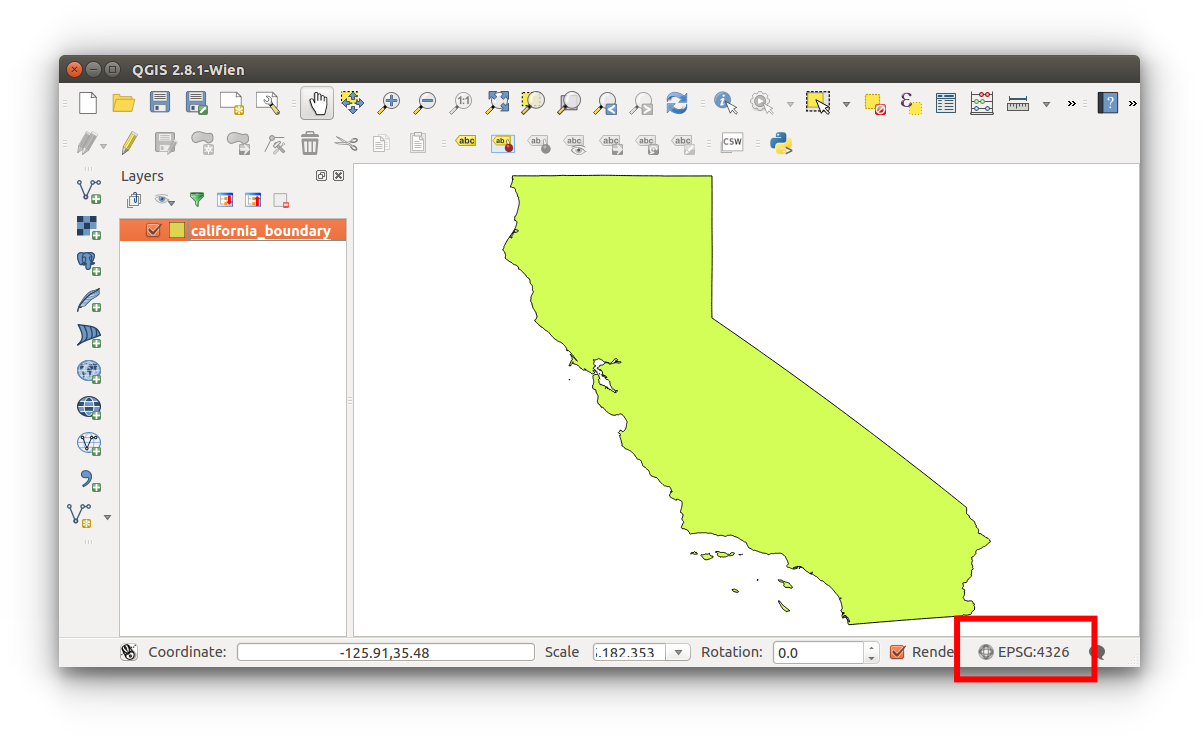
You can also click this button to open the Project Properties CRS settings.
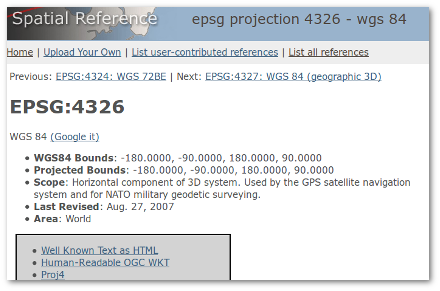
This current map projection is EPSG:4326. As it was discussed above, EPSG:4326 refers to World Geodetic System established in 1984, last revised in 2004 (as of May 2015) 1. This is a common reference system in web mapping and is also used with the GPS.
- There are several methods to configuring projections: set layer projections, set project projection (with on-the-fly projection), and reprojecting layers. There are also several methods to reprojecting layers which is covered later in this section.
- To change the project projection Menu Bar > Project > Project Properties > CRS
You're able to change the project projection to a predefined coordinate reference system (QGIS terms: CRS) or define your own. It's most probable that you'll be using a predefined CRS. You must enable 'on-the-fly' CRS transformation to change the project projection; this reprojects all subsequently imported layers to this defined CRS. CRSs will make or break your research. This will be discussed in later lessons.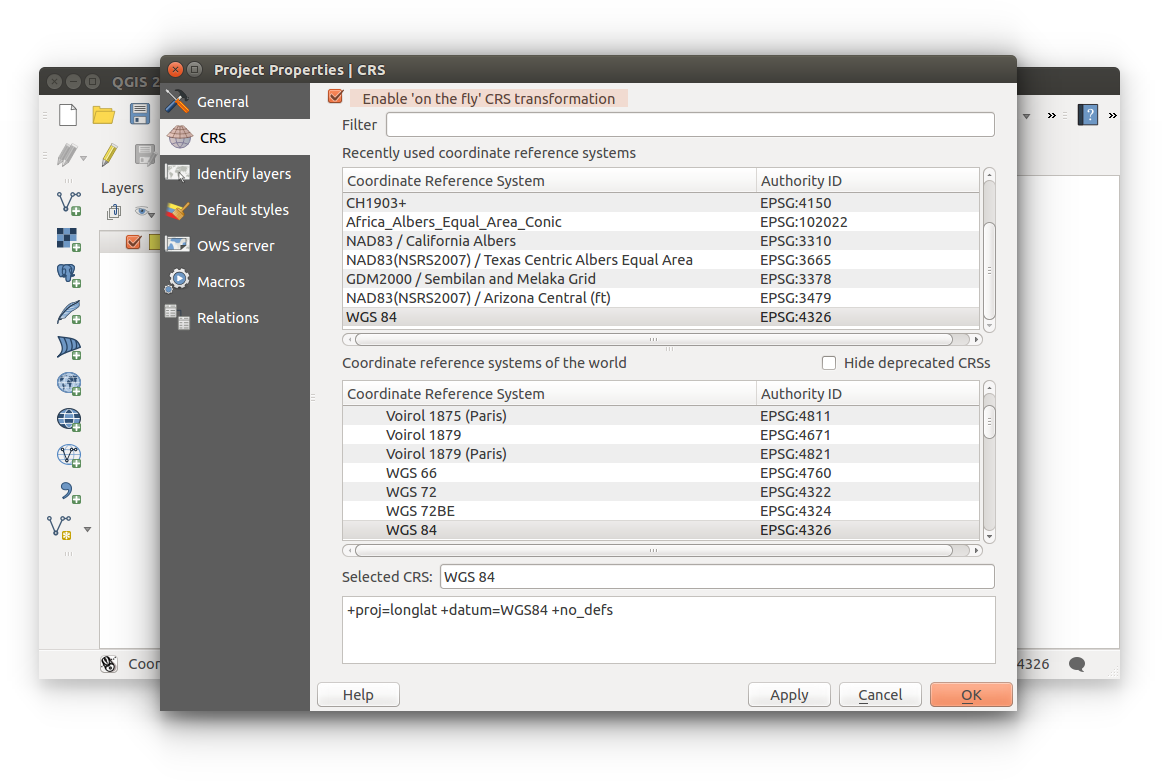
- Let's change the Projected Coordinate System and see how our data obscures each time. Search for EPSG:3378, just type '3378' in the filter and reproject our data.
Reminder: click Apply then OK to confirm changes each time.
If your data disapears from the map canvas: Right-click layer (layer list) > Zoom to layer.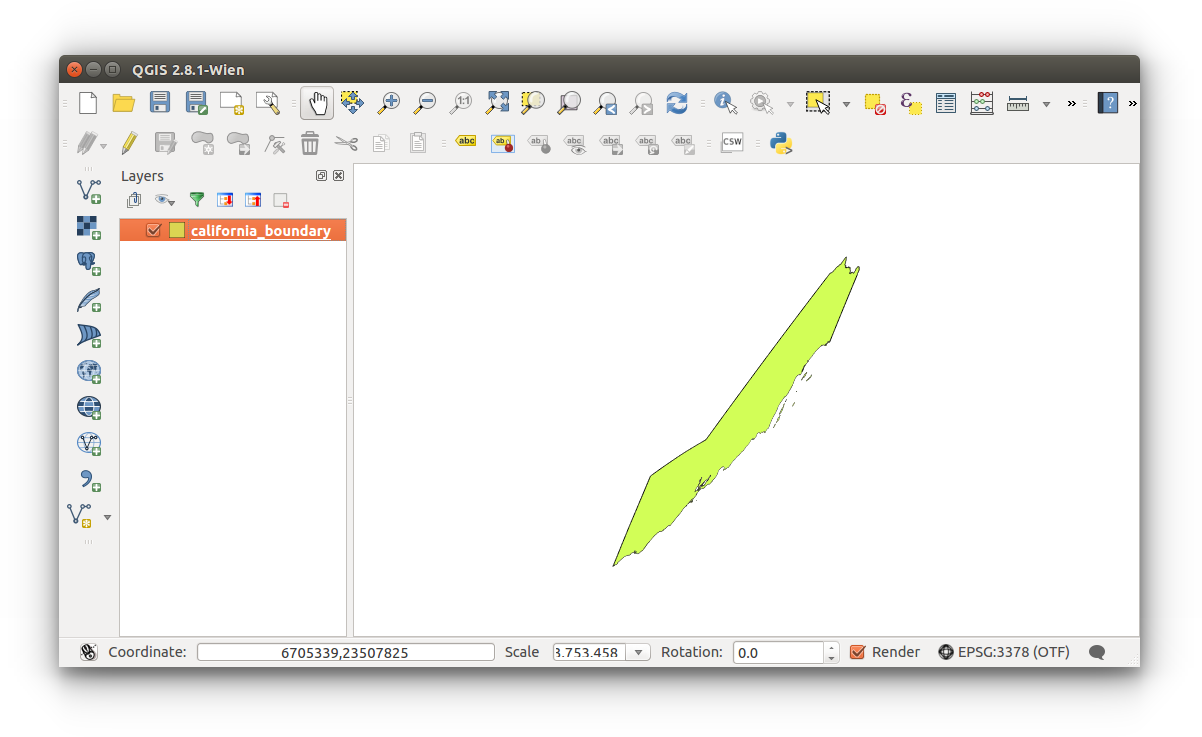
Reproject our data to EPSG:3311. What differences do you notice? Do you think you can compare (perform spatial functions) two different data sets, one with each projection?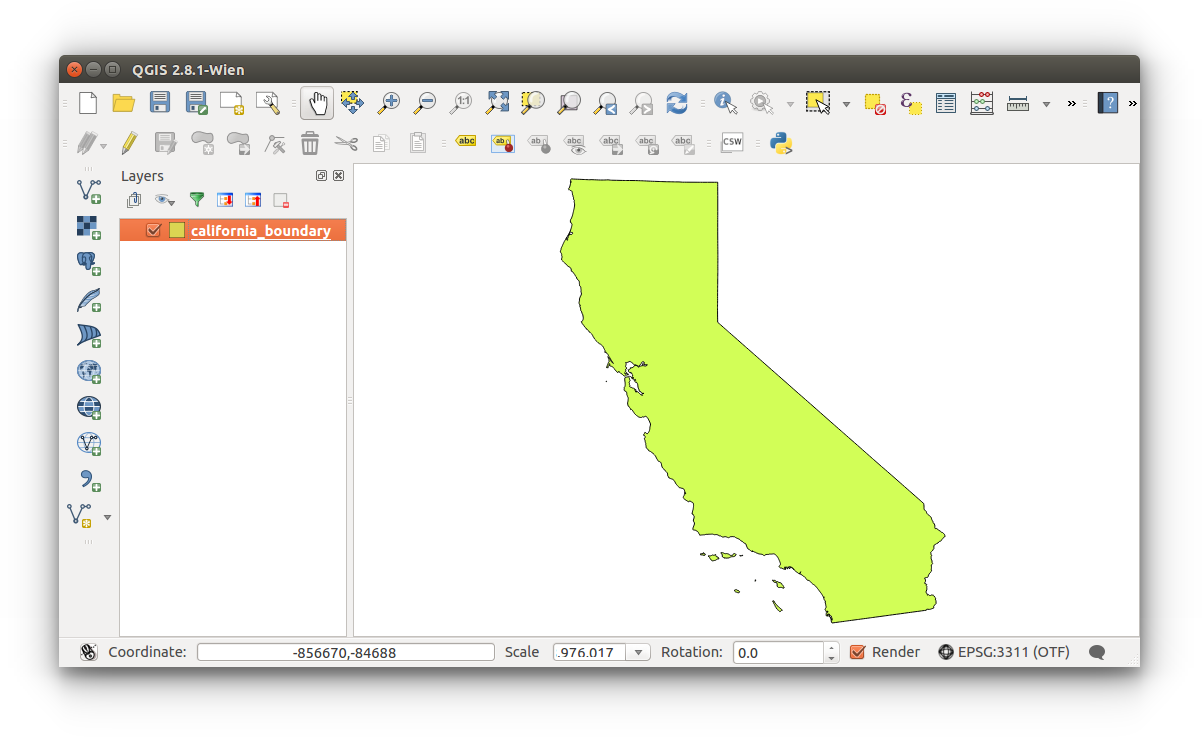
- Canvas/map units
- If we have space, we have distances. Check your Canvas Units to check our unit of measure: Menu Bar > Project Properties > General > Canvas Units.
If you're still using the ESPG:3311 projection, then you will be using Meters as your unit of measure. This is critical- you have two data sets, one with a projection in meters and the other in feet, do you think there will be any issues while performing a spatial function?
There are several ways to go about wrangling your data, some which will be covered in Data Collection and Data Wrangling.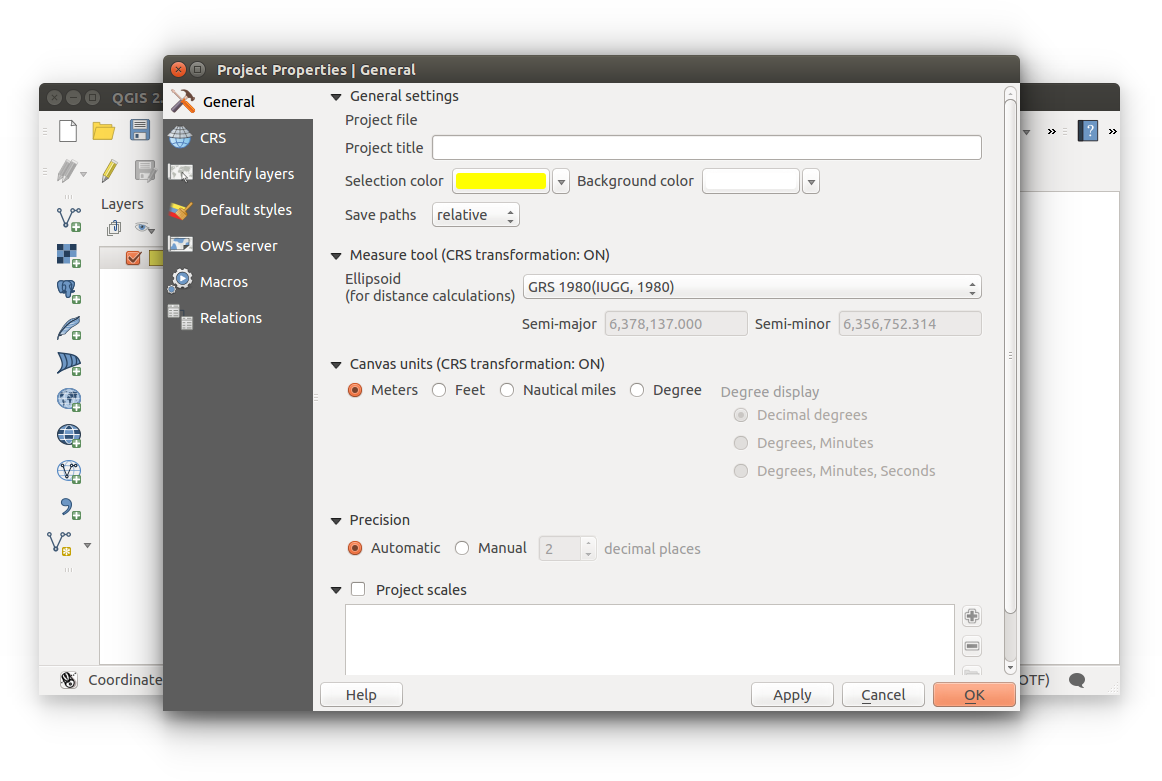 Close the Project Properties.
- If we have space, we have distances. Check your Canvas Units to check our unit of measure: Menu Bar > Project Properties > General > Canvas Units.
2. Reprojecting vector data
- Reproject data with geoalgorithms:
- Open the Processing Toolbox: Menu Bar > Processing > Toolbox
Then search "reproject", your results should be similar to the ones below. Double click on Reproject layer from the Vector category.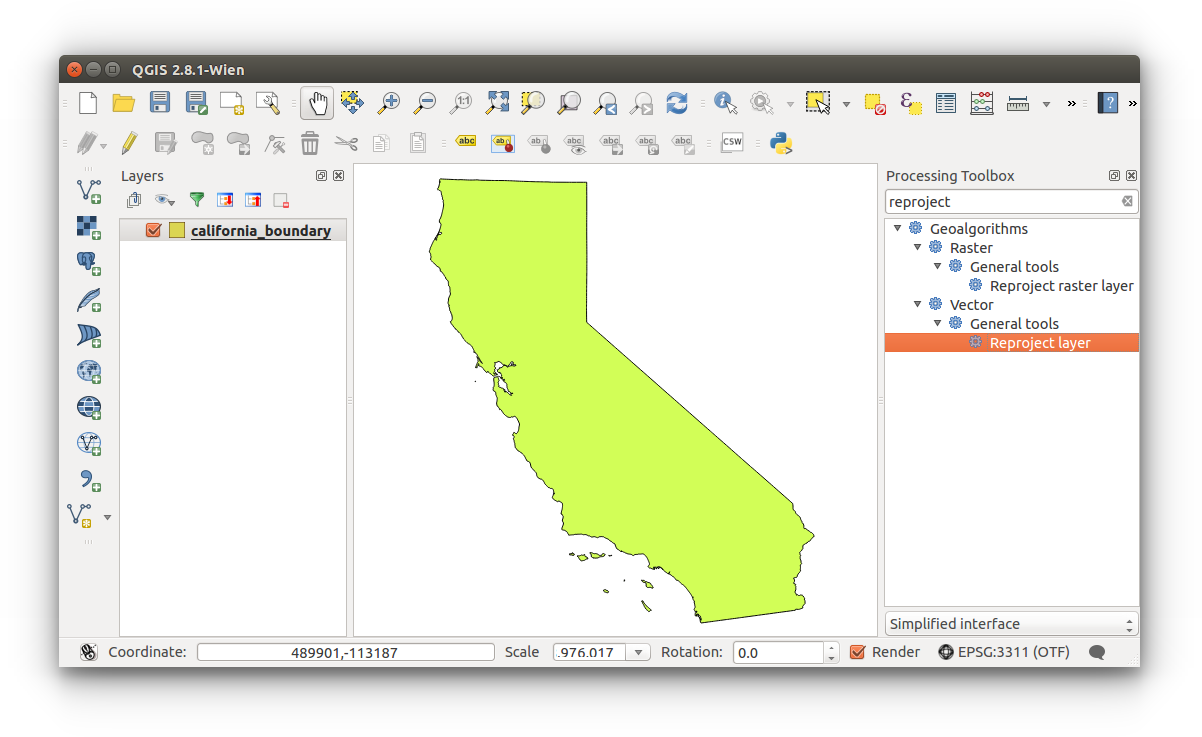
- Select Target CRS
- Input layer should be california_boundary [EPSG:4326].
Click the ellipses to the right of Target CRS and change the CRS to EPSG:3311.
A temporary (stored in memory) layer will be created if you do not define a file location. You must define a location if you wish to use this reprojected.
This how how you SAVE your vector layer with a given projection.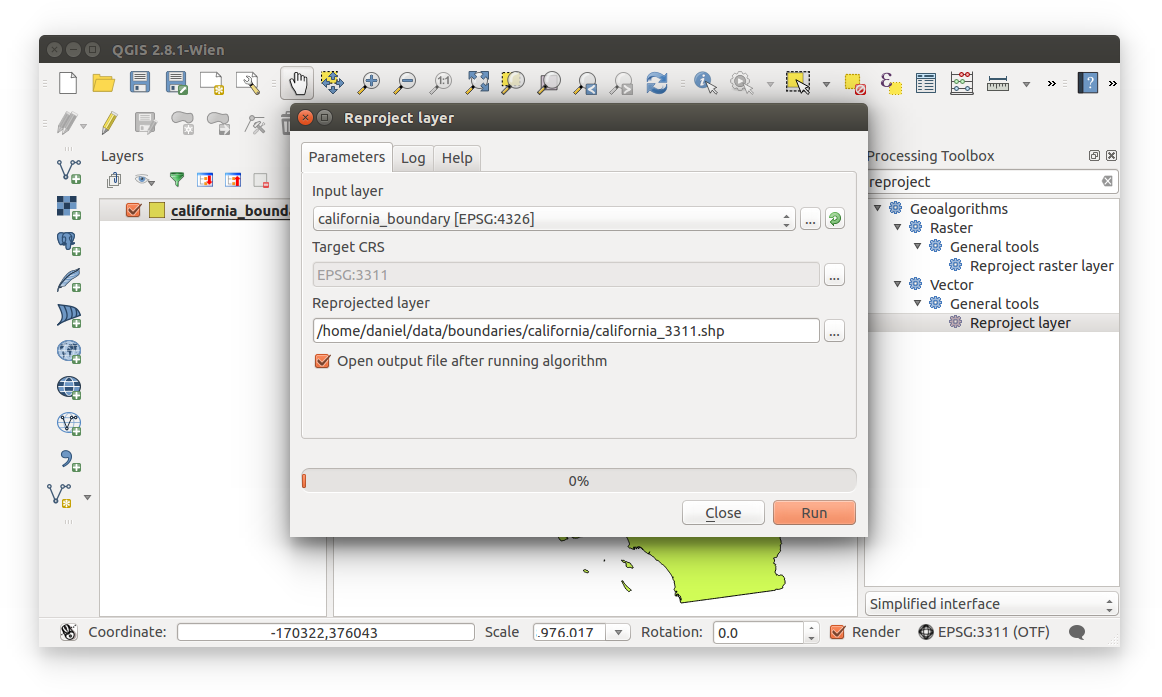
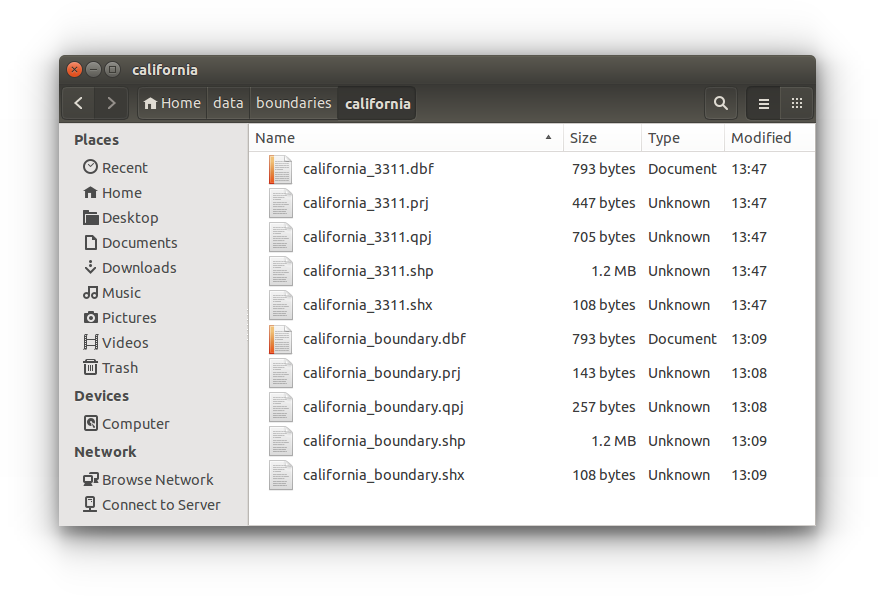
- The output shapefile is created with all necessary files. California boundary saved with EPSG:3311:
 Return to QGIS.
- Input layer should be california_boundary [EPSG:4326].
- Open the Processing Toolbox: Menu Bar > Processing > Toolbox
- Saving layer with projection (reprojection):
This one is simple: Right-click layer (layer list) > Save As > (see image below)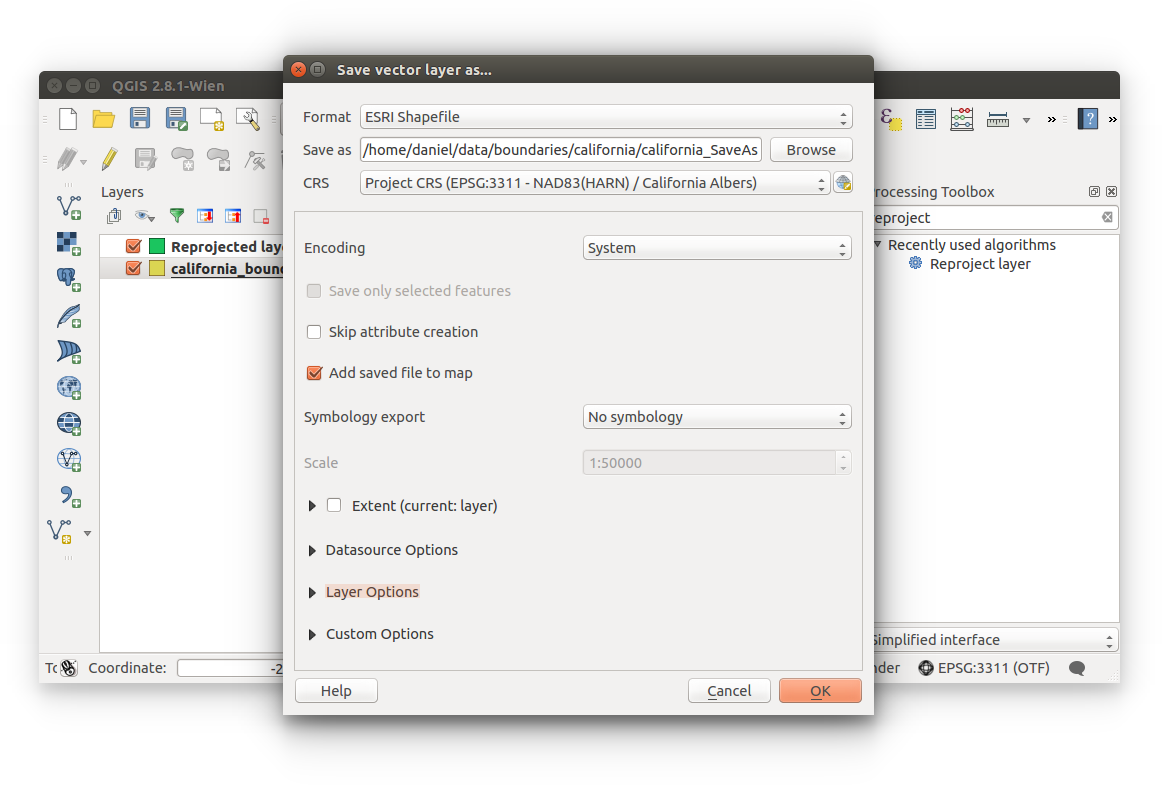
You have now been introduced to projections and their importance.
Close this project. - By Cartesian-coordinate-system.svg: K. Bolino derivative work: F l a n k e r (Cartesian-coordinate-system.svg) [Public domain], via Wikimedia Commons
- By Latitude_(PSF).png: Pearson Scott Foresman, donated to the Wikimedia Foundation derivative work: Gregors (talk) 08:13, 27 March 2011 (UTC) (Latitude_(PSF).png) [Public domain], via Wikimedia Commons
- By Longitude (PSF).png: Pearson Scott Forman derivative work: Gregors (Longitude (PSF).png) [CC BY-SA 3.0 (http://creativecommons.org/licenses/by-sa/3.0)], via Wikimedia Commons
- By Djexplo (Own work) [CC0], via Wikimedia Commons
- By Geek3 (Own work) [GFDL (http://www.gnu.org/copyleft/fdl.html) or CC BY-SA 3.0 (http://creativecommons.org/licenses/by-sa/3.0)], via Wikimedia Commons
- By NASA/JPL/University of Texas Center for Space Research. [Public domain], via Wikimedia Commons
- By NASA/JPL (http://sealevel.jpl.nasa.gov/gallery/posters.html) [Public domain], via Wikimedia Commons
- By Apletters (Own work) [CC BY-SA 3.0 (http://creativecommons.org/licenses/by-sa/3.0) or GFDL (http://www.gnu.org/copyleft/fdl.html)], via Wikimedia Commons
- By USGS, Mysid [Public domain], via Wikimedia Commons
- By Kai Krause [CC0], via Wikimedia Commons
- By Koenb at Dutch Wikipedia (Original text: productie van de afbeelding uit het .shp-bestand: Koenb) [Public domain], via Wikimedia Commons
- By RokerHRO (Own work) [GFDL (http://www.gnu.org/copyleft/fdl.html) or CC BY-SA 3.0 (http://creativecommons.org/licenses/by-sa/3.0)], via Wikimedia Commons
- By KoenB (Own work) [Public domain], via Wikimedia Commons
- By Koenb at nl.wikipedia (Original text : KoenB) [Public domain], from Wikimedia Commons
- By Chris Rywalt (POVRay) [GFDL (http://www.gnu.org/copyleft/fdl.html) or CC-BY-SA-3.0 (http://creativecommons.org/licenses/by-sa/3.0/)], via Wikimedia Commons
- http://www.progonos.com
![By Cartesian-coordinate-system.svg: K. Bolino derivative work: F l a n k e r (Cartesian-coordinate-system.svg) [Public domain], via Wikimedia Commons](http://commons.wikimedia.org/wiki/File%3ACartesian_coordinate_system_(comma).svg)
![By Latitude_(PSF).png: Pearson Scott Foresman, donated to the Wikimedia Foundation derivative work: Gregors (talk) 08:13, 27 March 2011 (UTC) (Latitude_(PSF).png) [Public domain], via Wikimedia Commons](http://commons.wikimedia.org/wiki/File%3ALatitude_lines.svg)
![By Longitude (PSF).png: Pearson Scott Forman derivative work: Gregors (Longitude (PSF).png) [CC BY-SA 3.0 (http://creativecommons.org/licenses/by-sa/3.0)], via Wikimedia Commons](http://commons.wikimedia.org/wiki/File%3ALongitude_blue.svg)
![By Djexplo (Own work) [CC0], via Wikimedia Commons](http://commons.wikimedia.org/wiki/File%3ALatitude_and_Longitude_of_the_Earth.svg)
![By Geek3 (Own work) [GFDL (http://www.gnu.org/copyleft/fdl.html) or CC BY-SA 3.0 (http://creativecommons.org/licenses/by-sa/3.0)], via Wikimedia Commons](http://commons.wikimedia.org/wiki/File%3ASphere_wireframe.svg)
![By NASA/JPL/University of Texas Center for Space Research. [Public domain], via Wikimedia Commons](http://commons.wikimedia.org/wiki/File%3AEarth_gravity.png)
![By NASA/JPL (http://sealevel.jpl.nasa.gov/gallery/posters.html) [Public domain], via Wikimedia Commons](http://commons.wikimedia.org/wiki/File%3AJason-1_measurement_system.gif)
![By Apletters (Own work) [CC BY-SA 3.0 (http://creativecommons.org/licenses/by-sa/3.0) or GFDL (http://www.gnu.org/copyleft/fdl.html)], via Wikimedia Commons](http://commons.wikimedia.org/wiki/File%3AMeridian-at-Greenwich.jpg)
![By USGS, Mysid [Public domain], via Wikimedia Commons](http://commons.wikimedia.org/wiki/File%3ALambert_conformal_conic.svg)
![By Kai Krause [CC0], via Wikimedia Commons](http://commons.wikimedia.org/wiki/File%3ATrue_size_of_Africa.jpg)
![By Koenb at Dutch Wikipedia (Original text: productie van de afbeelding uit het .shp-bestand: Koenb) [Public domain], via Wikimedia Commons](http://commons.wikimedia.org/wiki/File%3AWorld_borders_lambertcc000045.png)
![By RokerHRO (Own work) [GFDL (http://www.gnu.org/copyleft/fdl.html) or CC BY-SA 3.0 (http://creativecommons.org/licenses/by-sa/3.0)], via Wikimedia Commons](http://commons.wikimedia.org/wiki/File%3AAzimuthal_Equidistant_S90.jpg)
![By KoenB (Own work) [Public domain], via Wikimedia Commons](http://commons.wikimedia.org/wiki/File%3ACilinderprojectie-constructie.jpg)
![By Koenb at nl.wikipedia (Original text : KoenB) [Public domain], from Wikimedia Commons](http://commons.wikimedia.org/wiki/File%3APolyederprojectie-6-rendered.png)
![By Chris Rywalt (POVRay) [GFDL (http://www.gnu.org/copyleft/fdl.html) or CC-BY-SA-3.0 (http://creativecommons.org/licenses/by-sa/3.0/)], via Wikimedia Commons](http://commons.wikimedia.org/wiki/File%3ADymaxion_2003_animation_small1.gif)