Leaflet.js
![]()
This exercise covers the basics of developing a simple Leaflet.js web map.
Objectives:
- Convert shapefile into GeoJSON
- Write simple HTML document with Leaflet basemap
- Overlay GeoJSON file on Leaflet basemap
Resources:
Procedures:
1. Create site directory:
Create a new working diretory, this is where you will store your webpage documents and data. This is called the site root. The Leaflet HTML document will depend on your folder structures.
2. Create GeoJSON file
GeoJSON is a format for encoding a variety of geographic data structures - geojson.org
GeoJSON is similar to a shapfile in that it stores points, line strings, and polygons. Coordinates in latitude and longitude are stored for each point. Remember, points connect lines and polygons. Below is a view of the tracts-housing-values.shp in GeoJSON format.
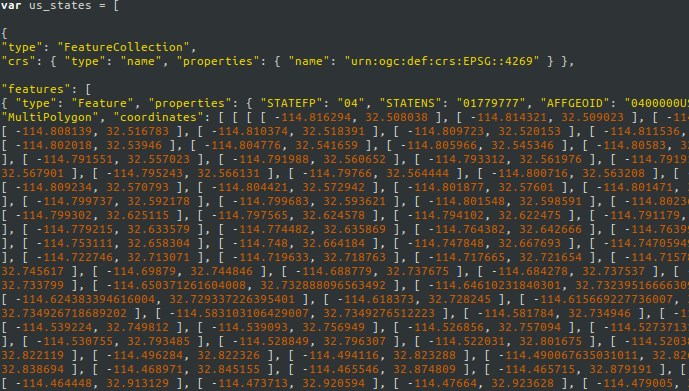
EPSG:3857 is the most common CRS for online maps and uses Spherical Mercator projections. This is used by almost all free and commercial tile providers. See Leaflet ICRS for more info. We're safe with just using our EPSG:4269 for this exercise (it's what the Census provided).
- Import cb_2013_us_state_500k.shp through iRods:
/iplant/home/shared/aegis/cartography/leaflet-exercise/cb_2013_us_state_500k.shp/
Or download, unzip, and Add Vector Layer:
cb_2013_us_state.zip
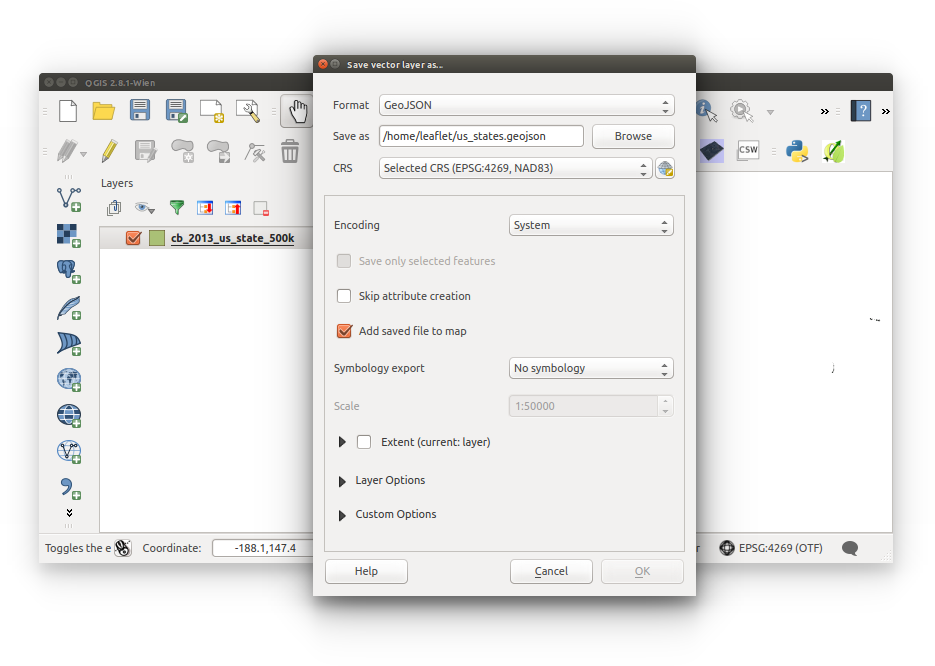
- Save As .geojson into your site root directory:
- Right-click layer > Save As
- Configure inputs as follows:
Format: GeoJSON
Save As: us_states.geojson CRS: default EPSG:4269 is acceptable
- Rename us_states.geojson to us_states.js
- Open us_states.js in a text editor (not Microsoft Word!) and create a JavaScript variable to call our US States data. The following JavaScript must be entered correctly, one small error and you will not be loading a layer into Leaflet:
- Before creating the us_states variable, I'll explain in simple terms. You don't want to store 25MB of GeoJSON code into your single-page web map document. We're going to reference an external source to call the GeoJSON code- the web browser loads all referenced files from the HEAD. So creating a variable in the us_states.js file will load properly when we open our leaflet.html file.
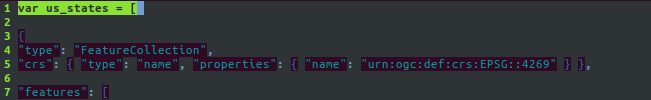
- Create us_states variable:
var us_states = [

// your geojson is here

// don't actually write anything with the '//' line-prefix

// it's a comment

// unless you want to write comments, of course

];
The GeoJSON code is within "features". Be sure the top of your us_states.js looks just like the code below. We've just added the code highlighted in green:

- So by this step, you should have a file named us_states.js with a us_states variable, and full of sptail data in GeoJSON format, that's stored in your working director.
3. Create HTML document
HTML documents provde the content and resources to your web browser to indicate what to render on your screen.- Open text editor (not Microsoft Word!)
- Copy and paste HTML skeleton. It's made up of the basic HTML tags. HTML elements are explained below:
<!DOCTYPE html>


<html>


<head>


</head>


<body>


</body>


</html>- !DOCTYPE indicates to the browser of the document type. In this case, it's an HTML document.
- HTML contains all elements and represents the root.
- HEAD provides metadata to the browser.
- SCRIPT is used to import executable scripts from a remote server (typical situation) or you can define script statements within the document.
- STYLE is used to import website styling or define styling within the page. Note, you can also use inline styling.
- BODY is where the content is stored.
- Save this document as leaflet.html, inside of your working directory.
4. Create Leaflet map
This next section should be painless. We'll be copying and pasting the code, but each item will still be explained so you'll know what to do the next time you want to develop a Leaflet web map. We'll be copying and pasting in blocks of code, by element sections:- Prepare the HEAD. Below, there are two external files being called to, leaflet.css and leaflet.js. These provide the functionality of the map and styling. There's a STYLE tag that allow us to define the divider height and width so the map may be visible. Copy and paste the following code between your HEAD tags:
<meta charset="utf-8">

<link rel="stylesheet" href="http://cdn.leafletjs.com/leaflet-0.7.3/leaflet.css">

<script src="http://cdn.leafletjs.com/leaflet-0.7.3/leaflet.js"></script>

<style>

  #map {   height: 500px;  width: 700px;}

</style> - Now for the hard part. The ID of the DIV below is equal to 'map', once we add our JavaScript you'll notice where 'map' is defined. Basically, we're using the DIV as a place to put our map. Copy and paste the following code between the BODY tags:
<div id="map"></div> - Add JavaScript to make the map function properly. We define 'map' with a center point and a zoom level. The variale grayScale is set to our basemap, which is added to the map with 'addTo.()'. Copy and paste the following code below the map DIV, between the BODY tags:
<script>

var map = L.map('map').setView([47,-100], 3);

var grayScale = L.tileLayer('https://{s}.tiles.mapbox.com/v3/{id}/{z}/{x}/{y}.png', {
attribution: 'Map data copywright <a href="http://openstreetmap.org">OpenStreetMap</a> contributors, ' +
'<a href="http://creativecommons.org/licenses/by-sa/2.0/">CC-BY-SA</a>, ' +
'Imagery copywright <a href="http://mapbox.com">Mapbox</a',
id: 'examples.map-20v6611k'
});

grayScale.addTo(map);

</script> - Save your leaflet.html document now. Before moving on, test it out by Right-click and open in a web browser. Your view should be the same as what's displayed below. If you've made one small mistake then the script won't run and you won't have a map. See this reference below if you run into any troubles.
- Call to the us_states.js script. The following code depends on the us_states.js file to be in the same folder as your leaflet.html. Copy and paste within the HEAD tag:
<script src="us_states.js"></script> - Add the layer to the map. Copy and paste within the SCRIPT tag within the BODY tag, below grayScale.addTo(map);
L.geoJson(us_states).addTo(map); -
- Your new Leaflet web map should look like the image below:
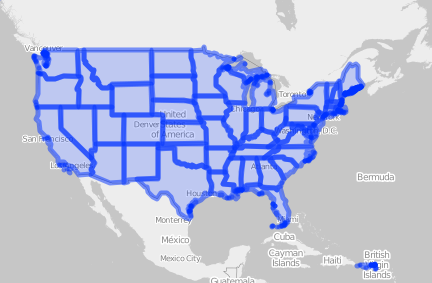
- Your new Leaflet web map should look like the image below:
- Before exporting tracts-values-units.shp into .geojson, calculate a new field named 'Values' that is equal to TotalValues. However, it needs to be calculated into a text field. Leaflet wasn't recognizing TotalValue as a numerical field (JavaScript didn't recognize the child node..).
- Export tracts-values-units.shp to .geojson, name this file wa_tracts.geojson. Then change file extension to .js (wa_tracts.js)
- Open your wa_tracts and make the entire GeoJSON a variable of wa_tracts:
var wa_tracts = [ // your geojson here // these are comments ]; - Create HTML document:
<!DOCTYPE html>


<html>


<head>


</head>


<body>


</body>


</html> - Be sure you reference the wa_tracts.js in the SCRIPT tag within HEAD:
<script src="wa_tracts.js"></script> - Define your map with center and zoom level within SCRIPT within BODY:
var map = L.map('map').setView([47.493,-120.563], 7); - Add a basemap within SCRIPT within BODY:
var grayScale = L.tileLayer('https://{s}.tiles.mapbox.com/v3/{id}/{z}/{x}/{y}.png', {
attribution: 'Map data copywright <a href="http://openstreetmap.org">OpenStreetMap</a> contributors, ' +
'<a href="http://creativecommons.org/licenses/by-sa/2.0/">CC-BY-SA</a>, ' +
'Imagery copywright <a href="http://mapbox.com">Mapbox</a',
d: 'examples.map-20v6611k'
});


grayScale.addTo(map); - Add wa_tracts.js wih styling within SCRIPT witin BODY:
function getColor(d) {

return d > 3009765000  ? '#BD0026' :

       d > 849985200  ? '#E31A1C' :

       d > 612002600  ? '#FC4E2A' :

       d > 483352000   ? '#FD8D3C' :

       d > 378603000  ? '#FEB24C' :

       d > 259410650   ? '#FED976' :

                  '#FFEDA0';

};


function style(feature) {

return {

    fillColor: getColor(feature.properties.TotalValue),

    weight: 2,

    opacity: 1,

    color: 'white',

    dashArray: '3',

    fillOpacity: 0.7

};

};


// HINT: notice 'layer.bindPopup(feature.properties.Value);'

// this is the same field that we calculated earlier from TotalValue into a text field.

// you can change the field that's displayed by changing the word 'Value'

// to the column header that you'd like to display

// e.g. replacing Value with GEOID will display each tract GEOID


L.geoJson(wa_tracts, {

    style: style,

    onEachFeature: function (feature, layer) {

    layer.bindPopup(feature.properties.Value);

    }

 }).addTo(map);
- Full document from US States Steps 4 and 5:
<!DOCTYPE html>

<html>

<head>


    <meta charset="utf-8">

    <link rel="stylesheet" href="http://cdn.leafletjs.com/leaflet-0.7.3/leaflet.css">

    <script src="http://cdn.leafletjs.com/leaflet-0.7.3/leaflet.js"></script>

    <script src="us_states"></script>


    <style>


      #map {   height: 500px;  width: 700px;}


    </style>

</head>


<body>


    <div id="map"></div>


    <script>


      var map = L.map('map').setView([47,-100], 3);


      var grayScale = L.tileLayer('https://{s}.tiles.mapbox.com/v3/{id}/{z}/{x}/{y}.png', {

attribution: 'Map data copywright <a href="http://openstreetmap.org">OpenStreetMap</a> contributors, ' +

'<a href="http://creativecommons.org/licenses/by-sa/2.0/">CC-BY-SA</a>, ' +

'Imagery copywright <a href="http://mapbox.com">Mapbox</a',

id: 'examples.map-20v6611k'

});


      grayScale.addTo(map);

      L.geoJson(us_states).addTo(map);


    </script>

</body>

</html>
5. Add layer to Leafet map
There are a few methods to serving spatial data.
We're going to reference our us_states.js script containing our GeoJSON data format that we converted from a shapefile.
We're going to continue our trusty copy-and-paste method to add our US States layer.
Additional Learning
Washington Census Tracts
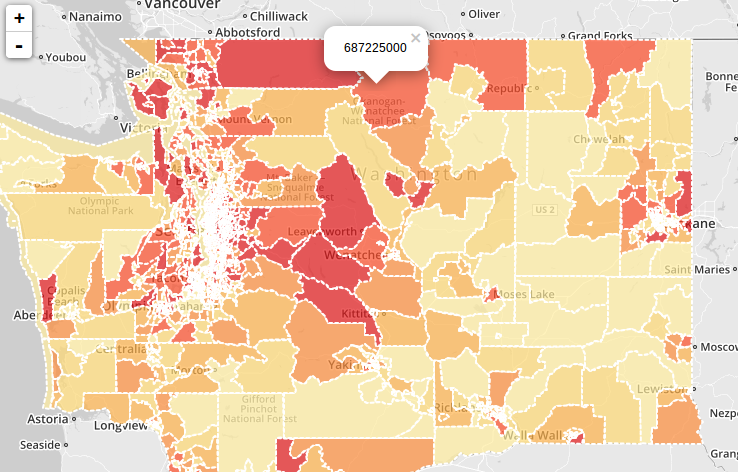
Now that you have a better understanding of QGIS, Leaflet, and GeoJSON, take a shot at visualizing Washington Census tracts (tracts-values-units.shp) in Leaflet. Also, add a functionality that displays the total housing value per tract on-click (in JS words, onClick). The document has already been created so use it as a reference as needed.
Exporting tracts-values-units.shp to .geojson results in a 25MB file. It may run a little slower the US States Leaflet we just made.
Guidance
A screenshot of Washington Census tracts with total home values on-click: